Human beings are more likely to attract to visual content, rather than text blocks.
Sharing eye-catching visuals on platform like Pinterest and Instagram has become a popular way to grow your online business.
Sharing nice photos can definitely catch your audience attention, but sharing insightful knowledge using statistics infographics would elevate your brand to the next level.
More importantly, it can help you convert viewers to buyers!
What is Statistics Infographic?
Statistics infographics is a visual that helps to represent data story. It is very useful to:
-
Tell a compelling story
-
Highlight most important messages to delivered to our target audience
-
Spread awareness to people (in hope that they realise their problem and (ideally) you have the exact solution to help them.)
Challenges: Reliable Stats and Facts
However, looking for reliable resources for the statistics may require a lot of effort and time. And even worse, you don’t know where to look for the statistics.
You also don’t want to simply pluck the numbers that you saw somewhere in the internet;
Remember, if you mislead your audience with inaccurate from unknown source, chances are your prospects would lose trust in you and you’ll never get them back.

How to Create Infographics in Canva for Free
In case you have your own data that you want to visualise using infographics and share with your audience, you might want to check out my Youtube tutorial below to learn how to create infographics in Canva - a free graphic design tool (with Case Studies), utilising Pictogram features.
How to Find Reliable Source for Infographics Design
In this article, I would like to share with you one of my go-to place to look for statistics: Statista.com.
With this website, you don’t have to worry about the credibility of your statistics; no more spending time designing infographics in Canva! Now you can free-up your time and do more impactful things for your business.
Why waste your time designing infographic from scratch when it’s already being done by professionals?
Why Statista?
Here is why I like Statista:
Reliable
Statista has become highly credible and trustworthy as their articles and stats are cited by the mainstream media like Financial Times, Forbes, The New York Times, which proves how reliable it is to use the statistics posted on their website for your business marketing content.
Professional
Their infographics are designed by professional data journalist. The information representation and design are of top notch quality, visually appealing and informative!
Royalty-Free
One GREAT thing is that these nice-designed pieces can be used for FREE for personal or commercial purpose, granted under Creative Common (CC) license.
Use is, however, only permitted with proper attribution to Statista. When publishing one of these graphics, please include a backlink to the respective infographic URL, just like how I did in the end of this article.
Wide-Variety Topics
The topics covered by Statista’s Chart of the Day are very diverse, ranging from environmental issues to politics, such as election.
How Infographics can be Useful to Your Business ?

Not only we have a visually-appealing infographics, but we also have a comprehensive article to support and further elaborate content shown in the graphics.
Another good example would be this world map.
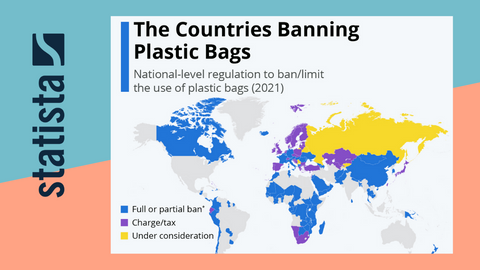
How it Helps your Business?
Well, the map clearly shows that many countries have started to ban fully or partially on the usage of plastic bags. Some have even charged or tax on the plastics usage. When your audience saw that the company they are located at has started to ban or impose tax to plastics packaging, they’ll start to look for alternatives - which is the product you are selling!
How to Search for Industry Related Statistics?
If you are in different niche, and you just want to get the pieces that are related to your industry. Here's a quick guide on how to find the statistics and fact for your content in Statista.com.
Head over to https://www.statista.com/search/ and search for the topics.

Say if you are interested in advertisement industry, type in “advertising” in the search bar. You’ll be shown all the relevant statistics, studies and reports.

Step 2: Type in keyword in the search bar.
Next, untick everything except Infographics, and click Refresh Search to filter results that comes with an infographic.
Click on one of the listing, and you’ll be directed to the article with the infographics photo that is READY for you to be post on your social media or websites!

Step 3 : Select Infographics
How to Download the Infographics?
To download the visual, simply click on Download Chart located at the right side of the visual.
Right click and select Save Image As... to save it as an image to your local laptop.

How to Use the Graphics for Free?
To use the graphics or infographics from Statista.com, you’ll need to include a link back to Statista.
You may copy the url from URL TO BE USED AS REFERENCE LINK: section beside the graphics, and paste it to your article or description.